
IPM-ПОДХОД С БИОГЕННЫМИ СТИМУЛЯТОРАМИ И БИОУДОБРЕНИЯМИ ДЛЯ БОБОВО-ЗЛАКОВЫХ СМЕСЕЙ: ОБЕСПЕЧЕНИЕ ДОЛГОСРОЧНОЙ РЕЗИСТЕНТНОСТИ К СТРЕССОРАМ ВМЕСТО КРАТКОСРОЧНЫХ УРОЖАЙНЫХ ПИКОВ В КАЛИНИНГРАДСКОЙ ОБЛАСТИ
IPM-ПОДХОД С БИОГЕННЫМИ СТИМУЛЯТОРАМИ И БИОУДОБРЕНИЯМИ ДЛЯ БОБОВО-ЗЛАКОВЫХ СМЕСЕЙ: ОБЕСПЕЧЕНИЕ ДОЛГОСРОЧНОЙ РЕЗИСТЕНТНОСТИ К СТРЕССОРАМ ВМЕСТО КРАТКОСРОЧНЫХ УРОЖАЙНЫХ ПИКОВ В КАЛИНИНГРАДСКОЙ ОБЛАСТИ

Аннотация
В ходе трехлетнего полевого исследования (2023–2025 гг.) на дерново-подзолистых почвах Полесского района Калининградской области была оценена эффективность интегрированной защиты растений (ИЗР) в сочетании с биогенными стимуляторами и хелатными микроэлементными удобрениями при выращивании смеси полевого гороха и овса (Pisum sativum subsp. arvense, сорт Зарянка + Avena sativa, сорт Факир; посев 30/70% от полной нормы высева каждого компонента). Анализ главных компонентов (АПК) 18 агробиологических переменных, проведенный на всех отдельных участках (адекватность выборки: показатель Кайзера–Мейера–Олкина = 0,79; тест сферичности Бартлетта, p < 0,001), выделил три компонента с собственными значениями > 1, которые в совокупности объясняют 91,2% общей дисперсии. Двумя ведущими компонентами были «биологический потенциал ризосферы» (ПК1, 54,7%) и «фитосанитарная стабильность» (ПК2, 26,7%).
Интегрированная система, сочетающая химическую обработку в пониженных дозах (Deposit ME) с биологической защитой в период вегетации (Fitosporin AS) и внекорневыми хелатными удобрениями (Ultramag Combi для бобовых, Biostim Maslichny, BionexChemi 10:10:10, Biopolimix), обеспечила стабильное увеличение урожайности зеленой массы на 51–61% по сравнению с необработанным контролем (и на 13–20% по сравнению с полностью химической системой А2), с соответствующим увеличением урожайности семян, при этом снизив условную нагрузку пестицидов на 58–68% по сравнению с полной химической защитой. Межгодовой коэффициент вариации урожайности зеленой массы (урожай B1) составил V = 5,8–6,0% при комплексных обработках A5–A6, 15,3% при полной химической защите (A2) и 17,5% в контроле (A1); по всем показателям урожайности (зеленая масса, сухая масса и урожай семян) V колебался в пределах приблизительно 6–10% при комплексных обработках, 13–16% при химической защите и 17–21% в контроле. Масса азотфиксирующих клубеньков увеличилась в 1,9–2,3 раза, а численность полезных ризосферных бактерий возросла на 28–48%. Исследовательский метагеномный анализ гена 16S рРНК (один сезон, четыре обработки) показал обогащение ризосферы таксонами Bacillaceae, Rhizobiaceae и Pseudomonadaceae. Интегрированная система защиты растений (IPM) обеспечивает стабильно высокие урожаи в каждом вегетационном сезоне, а не максимизирует пиковые урожаи — стратегическое преимущество в условиях растущей климатической нестабильности.
1. Introduction
The maximum-yield paradigm that has dominated crop production for the past half-century is increasingly revealing its limits. Under global climate change, with the hydrothermal coefficient (HTC) of the growing season in north-western Russia varying from 1.15 to 2.72 within a single decade, the pursuit of record yields in favourable years results in catastrophic losses in unfavourable ones . An agronomist focused on "peak productivity" applies maximum doses of fertilizers and pesticides calculated for an optimal scenario, and incurs losses when that scenario fails to materialize.
An alternative strategy — ensuring the long-term resistance of the agrocenosis to stressors - relies on developing internal biological resilience mechanisms that function independently of any particular set of weather conditions , . Key elements of such resilience — an active rhizosphere microbiota, an effective symbiotic apparatus of the legume component, and optimized micronutrient nutrition — are suppressed by conventional chemical protection , .
The field-pea–oat mixture is a basic forage crop in the Kaliningrad region, providing early high-protein feed for dairy herds and biological fixation of 60–120 kg ha-1 of atmospheric nitrogen . However, the standard technology with a full range of chemical pesticides creates a fundamental contradiction: triazole fungicides suppress Rhizobium leguminosarum, the symbiont of field pea, reducing nitrogen-fixation efficiency by 20–40% ; neonicotinoid insecticides inhibit nitrifying bacteria ; and herbicide residues constrain the choice of subsequent crops in the rotation.
The Integrated Pest Management (IPM) concept does not abandon chemical control but rationally minimizes it, compensating with biological means . Modern biopreparations based on Bacillus subtilis, chelated micronutrient fertilizers containing nitrogenase cofactors (Mo, Co), and amino-acid biostimulants provide the tools for implementing this approach , .
It is fundamentally important that the cultivation technology be adaptive — adjustable to a specific growing season and field — rather than dogmatically reproduced from a single process chart. It is precisely this adaptability that ensures consistency of results across years , .
The present work develops the results of our previous study , which examined the use of growth biostimulants and chelated micronutrient fertilizers in the Kaliningrad region. Whereas focused chiefly on the direct effect of these products on yield, the present study, for the first time in the region, applies multivariate statistical analysis (PCA) to 18 agrobiological parameters, performs a metagenomic analysis of the rhizosphere, and provides a multi-year assessment of yield stability. This shifts the focus from documenting the effect of the products to describing the associations that accompany the stabilization of productivity through the microbiome.
The aim of the study was to evaluate, on the basis of multivariate statistical analysis (PCA), the combined influence of IPM systems with biogenic stimulants and chelated fertilizers on the set of production, quality, symbiotic and microbiological parameters of the field-pea–oat mixture, and to identify a strategy associated with high-yield stability under the climatic instability of the Kaliningrad region.
2. Research methods and principles
The studies were conducted in 2023–2025 on the experimental field of the Kaliningrad Research Institute of Agriculture, a branch of the V.R. Williams Federal Research Center of Forage Production and Agroecology (Polesie district, 54°52′ N, 21°06′ E).
2.1. Initial soil conditions
The soil is sod-podzolic medium loam. Its agrochemical characteristics in the arable layer (0–20 cm), determined before the start of the experiment (mean of three background samples), were as follows: humus (Tyurin method) 2.1%; pH(KCl) 5.5; hydrolytic acidity 2.8 cmol(+) kg-1; sum of exchangeable bases (S) 12.4 cmol(+) kg-1; cation exchange capacity (CEC) 15.2 cmol(+) kg-1; base saturation (V) 81.6%; mobile phosphorus P2O5 (Kirsanov method) 32.6 mg 100 g-1; exchangeable potassium K2O (Kirsanov method) 34.3 mg 100 g-1; total nitrogen (Kjeldahl) 0.12%; alkaline-hydrolysable nitrogen (Cornfield method) 78 mg kg-1; nitrate nitrogen (N-NO3) 9.5 mg kg-1 and ammonium nitrogen (N-NH4) 12.2 mg kg-1. Plant-available (mobile) micronutrients relevant to the applied chelated fertilizers were: boron (B) 0.42 mg kg-1, molybdenum (Mo) 0.11 mg kg-1, cobalt (Co) 0.18 mg kg-1, manganese (Mn) 24.5 mg kg-1, zinc (Zn) 1.6 mg kg-1 and copper (Cu) 1.4 mg kg-1. According to regional grading, the site was moderately supplied with phosphorus and potassium and had low-to-moderate availability of boron, molybdenum, cobalt and zinc, which provided an agrochemically justified background for testing chelated micronutrient fertilizers and legume symbiosis. The initial agrochemical status was uniform across the experimental area (coefficient of variation of the key indicators between background samples < 8%), so that the treatment effects reported below were assessed against a homogeneous soil background.
2.2. Preceding crop
The preceding treatment of the field was bare (black) fallow, in which the soil was kept free of vegetation during the previous season by mechanical tillage (two to three shallow cultivations) without the application of herbicides or organic fertilizers; no crop was grown, and no plant residues were incorporated. This term is used here in this narrow sense to avoid ambiguity.
Meteorological conditions differed substantially among years: 2023 was close to normal (HTC 1.35); 2024 was moderately moist (HTC 1.62, precipitation +18% above normal); and 2025 had a moderately dry first half of the growing season with excess precipitation in August–October (HTC 2.7, precipitation +118% above normal). This contrast provided a representative sample of climatic scenarios for assessing system stability.
2.3. Object
A spring mixture of field pea (Pisum sativum subsp. arvense) cv. Zaryanka (1.25 million germinable seeds ha-1) and oats (Avena sativa L.) cv. Fakir (4.0 million germinable seeds ha-1). The 30 : 70 ratio denotes the percentage of the full single-species seeding rate of each component (i.e. field pea was sown at 30% and oats at 70% of their respective full pure-stand norms), not the share of each species in the mixture; the absolute seeding rates given above correspond to these reduced proportions.
2.4. Experimental design
A two-factor field experiment:
1. Factor A — six protection and nutrition systems (Table 1).
2. Factor B — three harvest dates (B1: oat heading + field-pea flowering; B2: milk–wax ripeness; B3: full ripeness, seeds).
Three replications, randomized blocks, plot area 25 m2.
Protection and nutrition systems (Factor A)
the conditional pesticide load was calculated as the sum, over all applied products, of the product of each preparation's application rate by its relative hazard coefficient, expressed as a percentage of the full chemical standard (A2 = 100 %); the control and full-biological treatments received no synthetic pesticides (0 %); treatments A4–A6 used a single reduced-rate fungicide treatment plus a reduced-rate herbicide, yielding a load of 35 % of the standard; the reported overall reduction of 58–68 % refers to the season-cumulative load relative to A2 across the experimental years and accounts for the omission of repeated chemical fungicide and insecticide applications used in A2; the per-treatment value of 35 % and the cumulative reduction of 58–68 % are therefore mutually consistent
Treatment | System | Conditional pesticide load, units* |
A1 | Control (N30P60K60 + rhizotorfin) | 0 |
A2 | Full chemical (Deposit ME + Gellert KE + Borey Neo + herbicide) | 100 |
A3 | Full biological (Fitosporin AS + Gumi-20 + BioLipoStim) | 0 |
A4 | Basic IPM (Deposit ME + Fitosporin AS during vegetation) | 35 |
A5 | IPM + biostimulant + chelates (A4 + Biostim Maslichny + Ultramag Combi + BionexChemi) | 35 |
A6 | IPM + full complex (A5 + Biopolimix + Borogum Extra) | 35 |
The basal mineral fertilizer N30P60K60 was applied in all treatments, and field-pea seeds were inoculated with rhizotorfin (Rhizobium leguminosarum bv. viciae) in all treatments.
Sampling scheme and accounting methods. All indicators were determined for each of the three field replications of every treatment; the values reported in the tables are treatment means with standard deviations. Sampling was tied to fixed phenological stages to ensure comparability among treatments and years.
2.5. Production indicators
Green-mass yield was determined by continuous weighing of the harvest from each plot at each harvest date (B1 — oat heading + field-pea flowering; B2 — milk–wax ripeness; B3 — full ripeness) and expressed in t ha-1; dry-matter yield was calculated from green-mass yield and the dry-matter content of a representative 1 kg subsample dried at 105 °C to constant weight. Seed yield of field pea and oat (harvest B3) was determined by threshing the harvest of each plot with separation of the components, adjusted to 14% moisture; 1000-seed weight was measured on two counted samples of 500 seeds per plot. Leaf area (by the cut-disc method), photosynthetic potential (PP) and net photosynthetic productivity (NPP) were determined at the B1 stage on 10 plants sampled per plot along two diagonals.
2.6. Symbiotic indicators
At the field-pea flowering stage (B1), root systems of 10 plants per plot were excavated within fixed 0.25 m2 frames (four frames per plot), washed free of soil, and the active (pink) nodules were detached, counted and weighed; nodule weight is expressed in g m-2. The nitrogen-fixation coefficient (%) was estimated by the reduced (acetylene-reduction-calibrated) method as the share of plant nitrogen derived from symbiotic fixation.
2.7. Microbiological indicators
Rhizosphere soil was sampled at the field-pea flowering stage (B1) from the root zone of the excavated plants; from each plot a composite sample was prepared by pooling and homogenizing subsamples from the four frames. Counts of ammonifying, oligonitrophilic, oligotrophic and aminoautotrophic bacteria and of micromycetes were determined by serial dilution and plating on selective media (meat-peptone agar, Ashby medium, starch–ammonia agar (KAA) and Czapek medium, respectively), with results expressed in CFU g-1 of oven-dry soil; three analytical replicates per composite sample were plated. The KAA/Czapek ratio was used as an index of the bacterial-to-fungal balance.
2.8. Quality indicators
Forage quality of the green mass (harvest B1) was determined on dried and milled composite samples (one per plot): crude protein by the Kjeldahl method (N × 6.25), crude fat by Soxhlet extraction, crude fibre by the Henneberg–Stohmann method; metabolizable energy (ME) and net energy for lactation (NEL) were calculated from the chemical composition using standard regression equations for ruminant forages. Protein content of field-pea grain (harvest B3) was determined by the Kjeldahl method.
2.9. Phytosanitary indicators
Disease prevalence (%) was assessed at the B1 stage on 100 plants per plot (four counts of 25 plants) as the proportion of affected plants; weed infestation (plants m⁻²) was counted within four fixed 0.25 m2 frames per plot before harvest.
2.10. Variables measured
The following 18 variables, determined as described above, were included in the PCA: green-mass yield (t ha-1), dry-matter yield (t ha-1), pea seed yield (t ha-1), oat seed yield (t ha-1), leaf area (thousand m2 ha-1), photosynthetic potential (PP, thousand m2 ha-1 day-1), net photosynthetic productivity (NPP, g m-2 day-1), nodule weight (g m-2), nitrogen-fixation coefficient (%), counts of ammonifying, oligonitrophilic, oligotrophic and aminoautotrophic bacteria (million CFU g-1), micromycetes (thousand CFU g-1), crude protein (% DM), crude fat (% DM), metabolizable energy (ME, MJ kg-1 DM), disease prevalence (%), weed infestation (plants m-2) and 1000-seed weight (g). All symbiotic, microbiological, phytosanitary and quality variables and the production variables of harvest B1 refer to the same phenological stage (field-pea flowering / oat heading), whereas seed yield and 1000-seed weight refer to full ripeness (B3); the implications of combining variables recorded at different developmental stages are addressed in the Statistical analysis section. Abbreviations:
PP — photosynthetic potential;
NPP — net photosynthetic productivity;
ME — metabolizable energy;
NEL — net energy for lactation;
CFU — colony-forming units;
KAA/Czapek — ratio of microbial counts on starch–ammonia agar to those on Czapek medium.
2.11. Metagenomic analysis
16S rRNA gene sequencing of the rhizosphere microbiome was performed for treatments A1, A2, A5 and A6 at the field-pea flowering stage in a single season (2025) on the Illumina MiSeq platform (V3–V4 region). For each treatment, three independent biological replicates (one composite sample per field replication, prepared as described above) were sequenced. Bioinformatic processing was carried out in QIIME 2 , and taxonomic classification used the SILVA 138 reference database. Differences in relative taxon abundance among treatments were tested by the Kruskal–Wallis test with Benjamini–Hochberg correction for multiple comparisons; community structure (beta diversity, Bray–Curtis) was tested by PERMANOVA (999 permutations). Given that sequencing covered only four of the six treatments, was restricted to a single season and relied on three biological replicates per treatment, the metagenomic results have limited statistical power and should be regarded as exploratory; they characterize the state of the microbiome in the specific conditions of 2025 and require confirmation across additional seasons and treatments.
Antinutrient content of field-pea grain (trypsin inhibitors — Kakade–Liener method, mg g-1; phytic acid — colorimetric method, % DM) was determined in treatments A1, A2, A5 and A6 at harvest B3.
2.12. Statistical analysis
Analysis of variance (ANOVA) was performed according to Dospekhov in Statistica 13.0; the least significant difference at the 5% level (LSD0.05) was used for mean comparisons.
Principal component analysis was applied to the correlation matrix of the 18 variables. Because the variables differ in nature and units of measurement (yields in t ha-1, microbial counts in CFU g-1, quality traits in % DM, etc.), all variables were standardized to zero mean and unit variance (z-transformation) prior to analysis; consequently the analysis was performed on the correlation (rather than covariance) matrix, so that each variable contributed equally irrespective of its original scale. The number of components to retain was determined by the Kaiser criterion (eigenvalues > 1) in combination with the scree plot; the eigenvalues of the three retained components were λ1 = 7.11, λ2 = 3.47 and λ3 = 1.27, corresponding to 54.7%, 26.7% and 9.8% of the total variance, respectively (91.2 % cumulatively), while the fourth eigenvalue (0.42) fell below unity.
We emphasize that PCA is an ordination and data-reduction technique that summarizes the covariation among variables; it does not test hypotheses about causation, and the component labels ("rhizosphere biological potential", "phytosanitary stability", "feed energy value") are interpretive descriptors of groups of co-varying variables rather than demonstrated causal factors.
The reference (main) analysis reported here was performed on the full array of individual plots (6 A × 3 B × 3 replications × 3 years = 162 observations), giving a ratio of observations to variables of 9 : 1, so that the correlation matrix is well conditioned; this array is the primary basis for the factor structure. In addition, an illustrative PCA was run on the 18 treatment combinations (6 A × 3 B) using three-year mean values, in which the observation unit coincides with the unit of agronomic interpretation. Because in the latter, averaged variant the number of observations is close to the number of variables — a situation carrying a risk of over-fitting and of an over-optimistic proportion of explained variance — this variant is retained only as an illustration; the factor structure of both analyses was mutually consistent. Sampling adequacy for the plot-level analysis was verified by the Kaiser–Meyer–Olkin (KMO) measure (0.79) and Bartlett's test of sphericity (χ2 = 412.6; p < 0.001), both confirming the applicability of factor analysis.
The set of 18 variables deliberately spans indicators of different biological natures and of two developmental stages (flowering/heading, B1; full ripeness, B3). This is conceptually justified by the aim of describing the agrocenosis as an integrated system in which production, symbiotic, microbiological and phytosanitary processes co-vary; combining stage-B1 and stage-B3 variables in a single ordination is admissible here because each observation retains a consistent set of variables and the analysis characterizes their joint covariation across treatments rather than temporal dynamics within a season. Nevertheless, this design decision means that the extracted components reflect between-treatment covariation of end-of-season outcomes and should be interpreted accordingly.
We note an inherent tension between averaging over years (in the illustrative analysis) and the study's central thesis of interannual stability, since averaging removes precisely the variance around which the argument on stability is built. For this reason, the interannual dimension is analysed separately through the coefficient of variation and the stability model (below), while the plot-level PCA, which retains the full year-to-year and within-treatment variance, serves as the basis for the factor interpretation. Averaging in the illustrative analysis was additionally supported by the absence of a statistically significant "treatment × year" interaction for the principal variables in the two-way ANOVA.
Yield stability was assessed by two independent measures. The first is the interannual coefficient of variation (V, %). The second is the Eberhart–Russell approach , in which yield of each treatment (Yij) is regressed on the environmental index Ij (the mean yield of all treatments in environment j): Yij = μi + bi·Ij + δij, where bi is the linear regression coefficient (bi ≈ 1 indicates average stability) and S2di is the variance of deviations from regression (S2di → 0 indicates high stability). To provide a single, directly comparable measure ranging from 0 to 1, we additionally computed a normalized stability index defined as SIi = 1 / (1 + S2di / S̄2d), where S̄2d is the mean deviation variance across treatments; by construction SI = 1.0 corresponds to a treatment with zero deviations from the regression line (absolute stability), and lower values reflect larger deviation variance. The reported values (0.62–0.95) refer to this normalized index and are therefore not identical to the Eberhart–Russell regression coefficient bi; the underlying bi and S2di values are given in the note to Table 3. Because the regression was based on only three environments (years), it has a very limited number of degrees of freedom (df = 1); the resulting stability parameters are therefore indicative and require confirmation as the time series is extended.
3. Results and discussion
3.1. Factor structure of productivity
Principal component analysis (full plot-level array) extracted three components with eigenvalues > 1 (λ1 = 7.11, λ2 = 3.47, λ3 = 1.27), collectively explaining 91.2% of the total variance (Table 2); the illustrative treatment-mean analysis yielded a consistent structure.
Principal-component structure and factor loadings of key variables
Variable | PC1 (54.7 %) | PC2 (26.7 %) | PC3 (9.8 %) |
Nodule weight, g m-2 | 0.95 | 0.12 | 0.08 |
Nitrogen-fixation coefficient, % | 0.92 | 0.15 | 0.11 |
Ammonifying bacteria | 0.89 | 0.08 | 0.14 |
Oligonitrophilic bacteria | 0.86 | 0.10 | 0.09 |
Crude protein, % DM | 0.88 | 0.22 | 0.18 |
Green-mass yield | 0.84 | 0.35 | 0.20 |
Photosynthetic potential (PP) | 0.82 | 0.28 | 0.25 |
Micromycetes, thousand CFU g-1 | −0.79 | −0.18 | 0.05 |
Disease prevalence, % | −0.25 | −0.91 | −0.08 |
Weed infestation, plants m-2 | −0.15 | −0.85 | −0.12 |
1000-seed weight, g | 0.30 | 0.74 | 0.22 |
Metabolizable energy (ME), MJ kg-1 DM | 0.35 | 0.28 | 0.78 |
Crude fat, % DM | 0.22 | 0.20 | 0.72 |
PC1, interpreted as "rhizosphere biological potential" (54.7 %), grouped high positive loadings for nodule weight (0.95), nitrogen-fixation coefficient (0.92), ammonifying (0.89) and oligonitrophilic (0.86) bacteria, crude protein (0.88), green-mass yield (0.84) and PP (0.82), together with a high negative loading for micromycetes (−0.79).
PC2, interpreted as "phytosanitary stability" (26.7%), was defined by negative loadings for disease prevalence (−0.91) and weed infestation (−0.85), and a positive loading for 1000-seed weight (0.74).
PC3, interpreted as "feed energy value" (9.8 %), reflected metabolizable energy (0.78) and crude fat (0.72).
Projecting the treatments onto the PC1–PC2 plane (Fig. 1) revealed four groupings: Cluster I (A1) — low values on both axes (weak symbiosis, high weed infestation); Cluster II (A2) — high PC2 but low PC1 (effective protection accompanied by low biological potential); Cluster III (A3) — high PC1 but reduced PC2 (active biology, limited phytosanitary control); and Cluster IV (A5, A6) — high values on both axes, with A4 in an intermediate position.
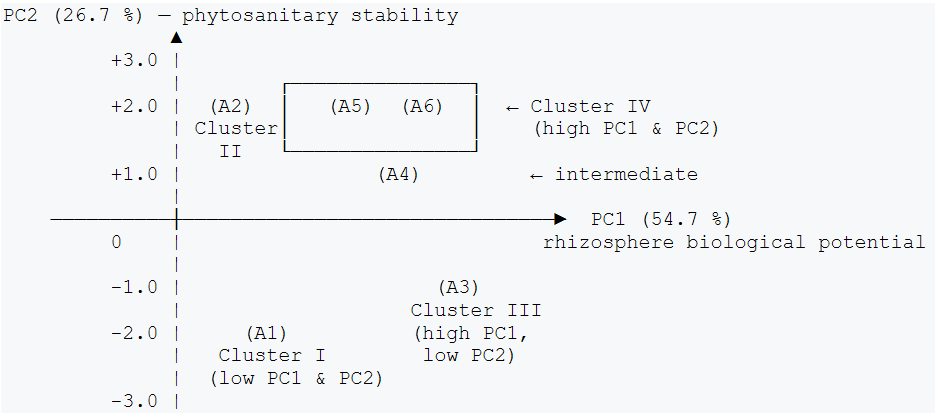
Ordination diagram of treatments in the plane of the first two principal components, showing the four treatment clusters
PC1 — "rhizosphere biological potential"; PC2 — "phytosanitary stability"
– Cluster II (A2) — high PC2 but low PC1 (effective protection accompanied by low biological potential);
– Cluster III (A3) — high PC1 but reduced PC2 (active biology, limited phytosanitary control);
– Cluster IV (A5, A6) — high values on both axes, with A4 in an intermediate position.
In descriptive terms, the group of variables associated with rhizosphere biological potential (PC1) accounted for about twice as much of the total variance among treatments as the phytosanitary group (PC2) (54.7% versus 26.7%). This describes the relative amount of between-treatment variation captured by each component and should not be read as a measured causal contribution to productivity. The chemical system (A2), while ranking high on PC2, scored low on PC1 and did not outperform the integrated treatments in overall standing across the two components.
3.2. Yield stability
The interannual yield dynamics and stability indicators of the field-pea–oat mixture are presented in Table 3.
Green-forage yield (t ha-1, harvest B1) and stability indicators
normalized stability index SI = 1 / (1 + S2di / S̄2d), where S2di is the Eberhart–Russell variance of deviations from regression and S̄2d its mean across treatments (SI = 1.0 = absolute stability); the corresponding Eberhart–Russell regression coefficients bi ranged from 1.18 (A1) and 1.12 (A2) to 0.96–0.98 (A5–A6), i.e. the integrated treatments approached bi ≈ 1 with the smallest deviation variance; based on three environments (df = 1) and thus indicative
Treatment | 2023 | 2024 | 2025 | Mean | V, % | Stability index* |
A1 | 19.8 | 21.5 | 15.2 | 18.8 ± 1.9 | 17.5 | 0.62 |
A2 | 26.5 | 28.2 | 20.8 | 25.2 ± 2.2 | 15.3 | 0.71 |
A3 | 22.0 | 23.8 | 19.5 | 21.8 ± 1.3 | 10.1 | 0.82 |
A4 | 25.8 | 27.5 | 23.2 | 25.5 ± 1.2 | 8.5 | 0.88 |
A5 | 28.5 | 30.2 | 26.8 | 28.5 ± 1.0 | 6.0 | 0.94 |
A6 | 30.2 | 32.0 | 28.5 | 30.2 ± 1.0 | 5.8 | 0.95 |
LSD₀.₀₅ (A) | — | — | — | 2.0 | — | — |
The highest absolute yield in 2024 was recorded in A6 (32.0 t ha-1), but the widest gap between the best and worst years occurred in A2 (7.4 t ha-1, or 28% of the mean) and A1 (6.3 t ha-1, 33%). In the integrated treatments A5–A6 this gap was only 3.4–3.5 t ha-1 (12%).
During the moderately dry start of the 2025 growing season, the amino-acid biostimulants (the osmoprotectants proline and glycine in Biostim Maslichny) were associated with maintenance of turgor and photosynthetic activity, as indicated by NPP: 5.0 g m-2 day-1 (A6) versus 3.8 g m-2 day-1 (A2) in May 2025.
Under the excessively wet conditions of the second half of 2025 (HTC 2.7), the chemical system A2 lost 21% of its mean yield, whereas A5 and A6 lost only 6%, which we tentatively attribute to increased leaching of mineral nitrogen and the development of fungal pathogens under these conditions. The integrated systems appear to have compensated for both factors through active nitrogen fixation and competitive suppression of pathogens by Bacillus subtilis.
3.3. Rhizosphere biological potential
The symbiotic apparatus and rhizosphere microbiota are presented in Table 4.
Symbiotic apparatus and rhizosphere microbiota (field-pea flowering stage, mean for 2023–2025)
Indicator | A1 | A2 | A3 | A4 | A5 | A6 | LSD0.05 |
Nodule weight, g m-2 | 7.2 ± 0.8 | 5.0 ± 0.6 | 11.5 ± 0.8 | 9.5 ± 0.7 | 13.8 ± 0.6 | 16.5 ± 0.6 | 1.0 |
Nitrogen-fixation coefficient, % | 38 ± 4 | 28 ± 4 | 50 ± 4 | 45 ± 4 | 58 ± 3 | 64 ± 3 | 5 |
Ammonifying bacteria, million CFU g⁻¹ | 6.2 ± 0.5 | 4.0 ± 0.4 | 8.5 ± 0.5 | 6.5 ± 0.5 | 8.0 ± 0.4 | 9.2 ± 0.4 | 0.7 |
Oligonitrophilic bacteria, million CFU g-1 | 4.0 ± 0.4 | 2.5 ± 0.3 | 5.8 ± 0.4 | 4.2 ± 0.3 | 5.5 ± 0.3 | 6.2 ± 0.3 | 0.5 |
Micromycetes, thousand CFU g-1 | 50 ± 5 | 68 ± 6 | 34 ± 4 | 48 ± 5 | 38 ± 4 | 32 ± 3 | 6 |
KAA/Czapek ratio (×103) | 185 | 95 | 365 | 200 | 315 | 410 | — |
In the chemical system (A2) the symbiotic apparatus was smaller: nodule weight was 31% lower than in the control and the nitrogen-fixation coefficient was 10 percentage points lower. At the same time, micromycete counts were 36% higher, forming a fungal-dominated community (KAA/Czapek = 95 × 103) — an indicator of a balance less favourable for subsequent crops.
In the IPM treatments A5–A6 the symbiotic apparatus was largest: nodule weight exceeded the control by 1.9–2.3-fold and the nitrogen-fixation coefficient reached 58–64% (corresponding to an estimated fixation of 85–115 kg ha-1 N2). A KAA/Czapek ratio of 315–410 × 103 indicates a bacterially dominated microbiocenosis.
Exploratory metagenomic sequencing of the 16S rRNA rhizosphere profile (2025; four treatments; n = 3 biological replicates per treatment) yielded 1847 operational taxonomic units (OTUs) at a 97% similarity threshold. The Shannon alpha-diversity index was 5.82 (A1), 4.95 (A2), 6.35 (A5) and 6.48 (A6). Alpha diversity was lower in the chemical system than in the IPM treatments; given the single-season design and the minimal replication, these differences should be interpreted with caution as to their generality.
At the family level, treatments A5–A6 showed a higher relative abundance of Bacillaceae (8.2–9.5% versus 3.1% in A2), Rhizobiaceae (5.8–6.5% versus 2.8%) and Pseudomonadaceae (4.5–5.2% versus 2.0%). In A2, the families Mortierellaceae (7.8% versus 3.2% in A6) and Nectriaceae (5.5% versus 1.8%), which include opportunistic fungi, were more abundant. Beta-diversity analysis (PERMANOVA, Bray–Curtis) indicated that treatments A5 and A6 formed a distinct grouping (p < 0.001) separate from both the control and the chemical treatment, consistent with the formation of a distinct "IPM microbiome". However, because the beta-diversity analysis rests on a sample of minimal size (four treatments, three replicates, one season), its statistical power is limited and the result pertains to the specific conditions of 2025; broader sampling is required before this observation can be generalized.
3.4. Forage quality and antinutrients
Forage quality and antinutrient indicators are presented in Table 5.
Green-forage quality (harvest B1, % DM) and field-pea grain (harvest B3), mean for 2023–2025
Indicator | A1 | A2 | A5 | A6 | LSD₀.₀₅ |
Green mass (B1) | |||||
Crude protein | 13.2 ± 0.4 | 14.0 ± 0.3 | 16.2 ± 0.3 | 17.0 ± 0.3 | 0.5 |
Crude fibre | 27.5 ± 0.7 | 26.8 ± 0.6 | 24.5 ± 0.5 | 23.8 ± 0.5 | 0.8 |
ME, MJ kg⁻¹ DM | 9.0 ± 0.2 | 9.3 ± 0.2 | 9.8 ± 0.2 | 10.2 ± 0.2 | 0.3 |
NEL, MJ kg⁻¹ DM | 5.2 ± 0.1 | 5.4 ± 0.1 | 5.8 ± 0.1 | 6.1 ± 0.1 | 0.2 |
Field-pea grain (B3) | |||||
Protein, % DM | 22.0 ± 0.4 | 22.5 ± 0.3 | 24.2 ± 0.3 | 24.8 ± 0.3 | 0.5 |
Trypsin inhibitors, mg g⁻¹ | 3.8 ± 0.3 | 3.5 ± 0.3 | 2.8 ± 0.2 | 2.5 ± 0.2 | 0.4 |
Phytic acid, % DM | 0.95 ± 0.05 | 0.90 ± 0.05 | 0.72 ± 0.04 | 0.65 ± 0.04 | 0.06 |
The crude-protein content of the green mass in A6 (17.0% DM) exceeded the control by 3.8 percentage points, which was associated with enhanced nitrogen fixation (r = 0.91 between nodule mass and protein content, p < 0.001); this correlation describes a co-variation and does not by itself establish causation. The metabolizable energy of 10.2 MJ kg-1 DM meets the requirements of high-yielding dairy cows.
The antinutrient results are of note: trypsin inhibitors in A6 grain (2.5 mg g-1) were significantly lower than in the control (3.8 mg g-1, −34%), as was phytic acid (−32%). Since enzyme activities (phytase, proteases) were not measured directly — only the levels of the antinutrients themselves were determined — the proposed biochemical interpretation should be regarded as a plausible mechanism consistent with the literature rather than as a directly demonstrated result. It may be hypothesized that the chelated micronutrients (Mn, Zn) activate phytase, the enzyme that degrades phytic acid , while optimal sulfur nutrition (4% S in Ultramag Combi) may stimulate the synthesis of sulfur-containing amino acids, which compete with trypsin-inhibitor synthesis for substrate.
3.5. Patterns of stabilization
The PCA structure is consistent with a stabilization pattern that can be described as follows. The variables grouped in PC1 ("rhizosphere biological potential") behave collectively as a "biological buffer" of the agrocenosis: a larger symbiotic system is associated with less sensitivity to mineral-nitrogen leaching in wet years; a more active rhizosphere microbiota accompanies lower disease pressure; and amino-acid osmoprotectants are associated with maintained photosynthesis under water stress. These associations, unlike the timed application of chemical pesticides, operate without additional agronomist intervention once the biological components are established. We stress that these relationships are correlational within the present design.
The normalized stability index of 0.94–0.95 for A5–A6 (versus 0.71 for A2) indicates that, among the tested treatments, the IPM systems showed the smallest deviations from the expected environment-dependent yield. For the farm, this is associated with greater predictability of feed supply.
3.6. Economic assessment
A simplified economic comparison was made for the two contrasting systems A2 and A6; it is a partial (gross-margin-type) estimate rather than a full profitability analysis, and its assumptions are stated explicitly. At a mean green-forage price of 2500 RUB t-1, the three-year cumulative gross revenue was 189 000 RUB ha-1 for A2 (75.6 t × 2500) and 226 500 RUB ha-1 for A6 (90.6 t × 2500), a gross-revenue difference of 37 500 RUB ha-1 in favour of A6. On the cost side, A6 incurs additional expenditure on biostimulants and chelated fertilizers of approximately 4500 RUB ha-1 yr-1 (≈ 13 500 RUB ha-1 over three years), whereas it uses fewer chemical plant-protection products than A2 (a single reduced-rate fungicide application and a reduced-rate herbicide instead of the full chemical schedule), giving an estimated saving of about 3000 RUB ha-1 yr-1 (≈ 9000 RUB ha-1 over three years). Taking both items into account, the net advantage of A6 over A2 is approximately 37 500 − 13 500 + 9000 = 33 000 RUB ha-1 over three years (≈ 11 000 RUB ha-1 yr-1); if the difference in plant-protection cost is disregarded, the corresponding figure is about 24 000 RUB ha-1. These figures are indicative: they are based on a single price scenario, assume otherwise comparable production costs (labour, machinery, basal fertilizer), and do not include a sensitivity analysis to price fluctuations; a full economic assessment was beyond the scope of this study and is required before firm conclusions on profitability can be drawn.
The contrasting seasons are consistent with an in-built adaptability of the IPM system. In the wet conditions of 2025, Bacillus subtilis (Fitosporin AS) can compete with pathogens at high soil moisture — conditions under which chemical fungicides are least effective (leaching, dilution). In the dry start of 2025, the amino acids of Biostim Maslichny (proline, glycine) may provide osmoprotection during water stress — a function chemical pesticides cannot perform.
This does not imply abandoning the process chart but transforming it from a rigid protocol into an adaptive algorithm with decision points, e.g.: "If the May HTC is < 1.2, increase the Biostim Maslichny dose to 2.0 L ha-1; if infestation exceeds the economic threshold, add a Fitosporin AS treatment."
Rhizosphere enrichment with Bacillaceae, Rhizobiaceae and Pseudomonadaceae in A5–A6 corresponds to a functional grouping potentially involved in pathogen biocontrol (Bacillus-antibiotic lipopeptides), nitrogen fixation (Rhizobium), and phosphorus solubilization and siderophore production (Pseudomonas). Within the limits of the single-season observation, this "IPM microbiome" is consistent with a self-sustaining community; whether it strengthens with continued use remains a hypothesis to be tested in longer-term studies.
4. Conclusion
Principal component analysis (performed on the full plot-level array and confirmed by an illustrative treatment-mean analysis) showed that the variables describing rhizosphere biological potential together accounted for the largest share of the between-treatment variation (PC1, 54.7%) — about twice that of the phytosanitary group (PC2, 26.7%). This describes the structure of covariation among the measured indicators and does not, by itself, establish a causal contribution of these factors to productivity. In the treatments studied, the IPM systems with biogenic stimulants and chelated fertilizers ranked high on both components simultaneously.
Among the tested treatments, the IPM systems A5–A6 combined high mean yields with the lowest interannual variability (V = 6–7% versus 15–17% in the control and chemical systems). Under the increasing climatic instability of the region, such stability is agronomically valuable; a conclusive assessment of its economic implications requires a dedicated long-term economic study.
For farms in the Kaliningrad region under conditions comparable to those studied, the transition from a fully chemical to an IPM system was associated with a reduction of the conditional pesticide load by 58–68%, an increase in mean green-mass yield of 51–61% relative to the control and of 13–20% relative to the full-chemical system (means over 2023–2025, harvest B1), a 2.5–3-fold reduction of interannual variability, and improved feed quality (protein +3.0–3.8 percentage points; ME +0.8–1.2 MJ kg-1), together with a shift toward a bacterially dominated rhizosphere microbiocenosis.
These conclusions should be read together with the study's limitations: the factor structure is descriptive and based primarily on the plot-level PCA; the metagenomic inferences (including the "IPM microbiome" and beta-diversity results) rest on a single-season, four-treatment sample of limited statistical power; the stability parameters are based on three environments (df = 1); and the economic figures are indicative partial estimates. Confirmation in further seasons, on a wider set of treatments, and with a full economic analysis is needed before the strategic recommendations can be generalized.